Heap size, memory usage and resource limits in Kubernetes for JVM applications


In Kubernetes, scaling applications vertically, that are primarily designed to scale horizontally (i.e. microservices) could be a challenging task. That's especially true for setting the right resource limits for your pod that is running a JVM application. In addition, memory management/usage of a JVM application is also an interesting topic, but this article is not about that. If you would like to get familiar with the core concepts of memory handling, heap and GC inside JVM, you should take a look on this comprehensive video first.
-Xms, -Xmx and the problem with them
As you probably already know, you can set the initial (Xms) and the maximum (Xmx) memory pool allocation for a JVM application with these flags. And they just work fine. For example, if you set -Xms128M and -Xmx256M and you start monitoring your application with VisualVM, you'll see something like this:
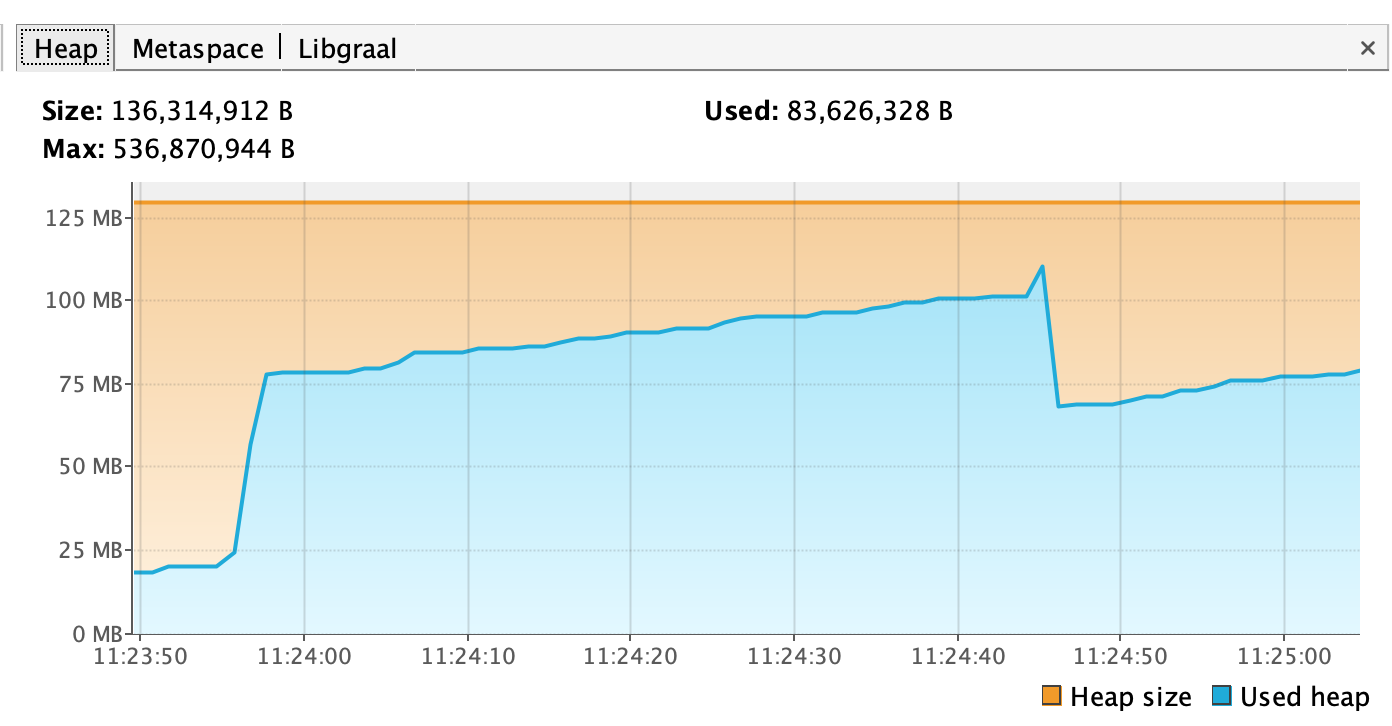
It seems totally fine, your application requests a minimum of 128MiB of memory, which means that it will be allocated to the heap right after the application starts, and will be limited to 256MiB afterwards. Let's check the overall memory usage of the same Java process (see the highlighted row):
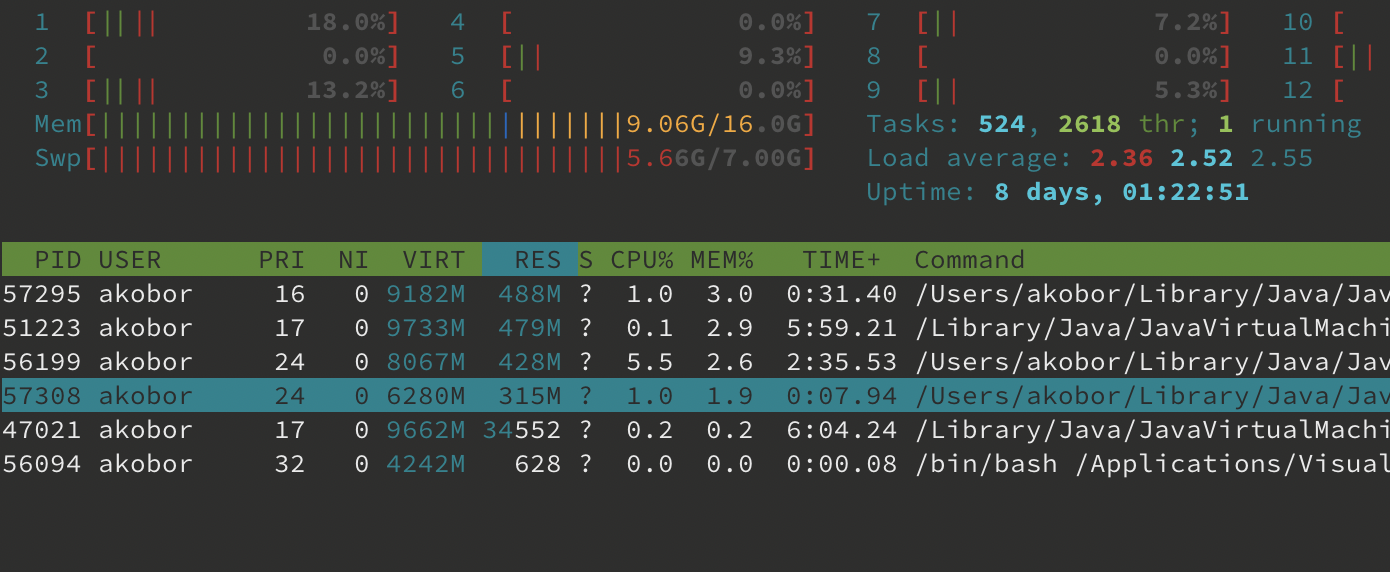
🙀 Well, that's a bit more than 256MiB... The reason behind this is that JVM uses memory outside the heap for other purposes as well (metaspace, code cache, etc.), while Xmx affects only the heap.
The NOT so happy path with resource limits
As your resources are limited inside a Kubernetes cluster, you have to be careful when it comes to the allocation of them, since you want to avoid the situation where one pod eats up all your resources, and the others will "starve".
Let's take the following example...
Setting Xms and Xmx inside a Docker image
You can pass these flags to your JAR in a Docker image like that:
# Dockerfile
# ...
ENTRYPOINT ["java", "-Xms128M ", "-Xmx256m", "-jar", "your-precious-service-1.0.0.jar"]
Alternatively, if you're using Jib, you can make it work like this in your build.gradle:
// build.gradle
jib {
    to {
        image = "yourorg/yourimage:tag"
    }
    container {
        environment = ["JAVA_TOOL_OPTIONS": "-Xms128M -Xmx256M"]
    }
}
Setting the memory limit in Kubernetes
If you are not aware of the things described above, you could easily end up with a configuration that will cause regular restarts to your pods due to OOMKilled. When it comes to memory limits, you can set the following parameters in your deplyoment:
apiVersion: apps/v1
kind: Deployment
metadata:
# ...
spec:
  # ...
  template:
    # ...
    spec:
      containers:
        - image: yourorg/yourimage:tag
          name: your-service
          resources:
            requests:
              memory: 128Mi # This is the minimum memory that is requested and allocated every time a pod has been created
            limits:
              memory: 256Mi # This is the memory limit for your pod. If your application uses more than this, the pod will be OOM killed
Let's assume that you set the limits above for your pod, since you've also set the same limits in your Docker image via -Xms and -Xmx flags. Then you deploy your service, it spins up without any issue, you are confident and highly satisfied, so you go to get some sleep. At this point you should make sure that you've also updated your job title on LinkedIn to something like "Kubernetes Evangelist". Next morning you check your pod, just to make sure everything's good, and you see this:
➜  ~ kubectl get po
NAME                              READY   STATUS    RESTARTS   AGE
your-service-5d65667768-qksk6     1/1     Running   56         8h
Well, that's not exactly what you would expect, right? You probably already have figured out what happened: as we've seen above, the memory usage of a JVM application is not just about the heap's size, so your pod get OOM killed several times as your application exceeded the pod's memory limit again and again.
The right approach
First of all: for the sake of example let's assume that your heap size limits inside your image are fine. However, if you want to make sure your application reserves all the heap it will use up-front, you could set Xms = Xmx as a rule of thumb.
Regarding your Kubernetes deployment's resource configuration, to avoid OOM kills you should take the following into account:
requests != Xms- More precisely, yourrequestsvalue should be definitely larger than yourXmx, and the difference depends on your application. If it's a "simple" microservice, you'll be OK with ~30% in addition, but if it's doing a lot of stuff outside the heap, you should consider providing a much larger value here.limits != Xmx- Again, these values are not interchangeable. Your pod's suggested memory limit depends on a lot of stuff (i.e. the used Java base image is an important factor here), so you have to choose it carefully. It might be a good practice to make some benchmarks with some stress testing to see, how much burst it generates in terms of the used memory when your application runs at its peak.- Setting a reasonably higher
limitsinitially is always a good practice. If it turns out that you've set it to an unnecessarily high value, you can decrease it whenever you want, without risking a constant pod eviction due to OOM errors.
To stick to the concrete case we described above: setting requests to ~320MiB and limits to ~512MiB would be a good start with the given Xms and Xmx values.
Generally speaking, the above suggestions could be useful, but the best strategy for setting resource limits in Kubernetes is to know your application's memory usage, because there is no formula that can be applied to every situation, since every application is unique.